
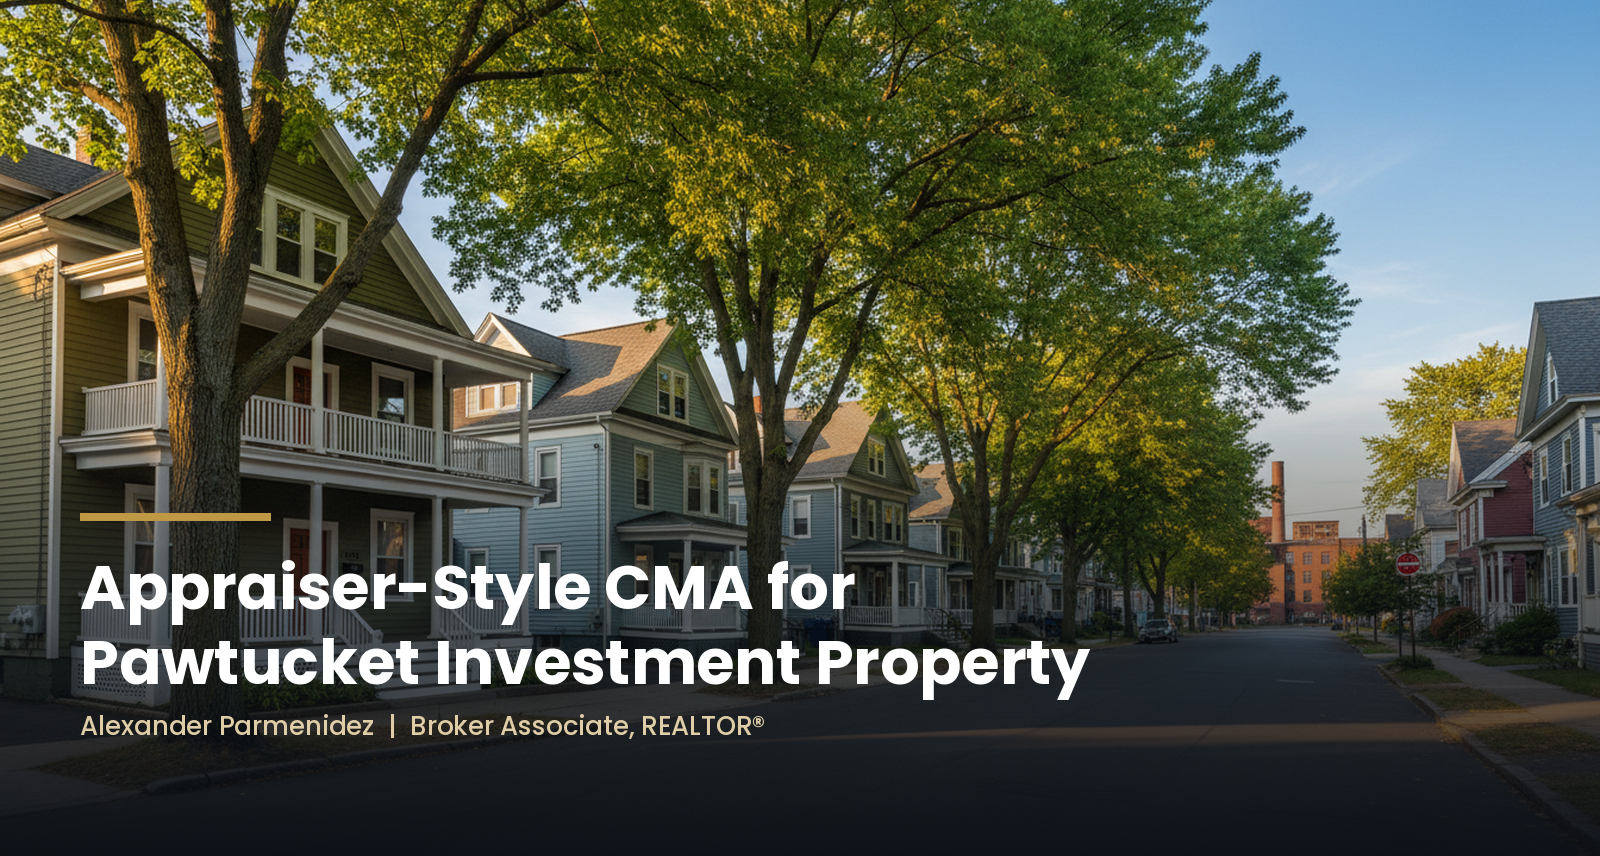
Appraiser-Style CMA for Pawtucket Investment Property: A Defensible ROI Analysis for 2026
TL;DR
An appraiser-style CMA for a Pawtucket investment property uses recent sold comps, price per square foot, days on market, and sale-to-list ratios to build a defensible value estimate. With Pawtucket's median sale price at about $441,000 and homes selling in roughly 22 days for the three months ending June 2026 (Redfin), precise and hyper-local data is what separates an accurate ROI projection from a guess.
An appraiser-style CMA goes beyond pulling three random comps. It applies the same methodology a licensed appraiser uses: adjusting for square footage, condition, property type, and time of sale to arrive at a data-backed value. In a market moving this fast, a sloppy comp selection can cost you thousands on either side of a deal.
Why the Pawtucket Market Demands Precision in 2026
Pawtucket is not a market where you can afford to be approximate. According to Redfin's Pawtucket housing market data for the three months ending June 2026, the median sale price was about $441,000, up 2.5% year-over-year, with a median price per square foot of roughly $252, up 1.8% from the prior year. Homes sold in about 22 days on average, barely changed from 21 days a year earlier, and the typical home went for about 1% above list price.
That pace matters for your CMA. When absorption is this fast, a comp from 12 months ago is already stale. I tell every investor I work with: in Pawtucket, your comparable sales window should be the prior three to six months, same sub-market, same property type, and similar condition. Anything older needs a time adjustment, and that adjustment has to be grounded in actual index movement, not a guess.
For long-term ROI framing, the FHFA All-Transactions House Price Index for the Providence-Warwick, RI-MA metro reached 452.64 in Q2 2026, up from 444.32 in Q1 2026. That confirms continued quarterly appreciation at the metro level through mid-2026 and gives buy-and-hold investors a federal-grade benchmark for modeling multi-year returns rather than relying on portal estimates alone. The index sits in the mid-400s against a 1995 baseline of 100, which is the kind of long trajectory you want in hand when you stress-test the exit assumptions on a duplex or triple-decker.
How Pawtucket Compares to Providence Proper
One of the most useful calibrations I run for investors is a side-by-side of Pawtucket versus Providence city. They share a border and the same metro, but their velocity and pricing differ enough to matter in a CMA.
| Metric | Pawtucket (3 months ending June 2026) | Providence city (as of July 31, 2026) |
|---|---|---|
| Median sale price / typical value | ~$441,000 median sale price | ~$437,919 typical home value (ZHVI) |
| Median price per sq ft | ~$252 | Not published on the value index |
| Days on market / to pending | ~22 days on market | ~14 days to pending |
| Year-over-year change | +2.5% | +2.1% |
| Sale vs. list | Typical home ~1% above list; hot homes ~5% above | Faster pending pace, similar price trend |
Sources: Redfin Pawtucket; Zillow Providence. Note that Redfin reports a median sale price and Zillow reports a typical home value index, so the two figures are related but not identical measures.
The takeaway: Providence goes pending faster, while Pawtucket's price growth has run slightly ahead over the past year. If you're pulling comps from the Providence side of the line for a Pawtucket property, you need to apply a location adjustment. An appraiser would. You should too.
The Appraiser-Style CMA Framework, Applied to Pawtucket Investment Property
Here's the framework I use when I run an appraiser-style CMA for an investment property in Pawtucket. This is the same logic a licensed appraiser applies, adapted for the investor's ROI lens.
Step 1: Define the comp pool correctly. Start with sold properties, not active listings. Active listings tell you what sellers are hoping for. Sold comps tell you what the market actually paid. For Pawtucket in 2026, I pull the prior three to six months of sales within the same sub-market, same property type (single-family, duplex, triple-decker), and similar gross living area. I give more weight to the most recent 90 days given the 22-day absorption rate. Because the FHFA index shows positive appreciation for the Providence-Warwick metro into Q2 2026, older comps from 2025 need a time adjustment upward, even if modest. Don't skip that step.
Step 2: Anchor to price per square foot. Pawtucket's median price per square foot of roughly $252 (June 2026 period, per Redfin) gives you a baseline. For investment properties, I use price per square foot as a primary check on the gross value estimate, then layer in price per unit for multifamily. Neither metric alone is sufficient, but together they flag outliers quickly. A rehabbed unit will command a premium over that $252 baseline. An unrehabbed property with deferred maintenance will trade below it. The appraiser-style approach quantifies that gap rather than eyeballing it. If you want to see how I apply this to multifamily specifically, my post on multifamily investment in Providence County goes deeper on the per-unit analysis.
Step 3: Analyze sale-to-list ratios and over-ask frequency. With the typical Pawtucket home closing about 1% above list and hot homes about 5% above, per Redfin's three-month compete data, investors cannot assume a deep discount to list unless the property is clearly distressed or mispriced. I use the sale-to-list ratio to calibrate my clients' offer strategy. A property that's been sitting with a price drop is a different conversation than a fresh listing in move-in condition. The CMA has to reflect that distinction.
Step 4: Adjust for condition, configuration, and use. This is where most investor CMAs break down. A two-family on the same street as a three-family is not a direct comp. A property with updated mechanicals and a legal second unit is not directly comparable to one with deferred maintenance and a non-conforming layout. Appraisers make line-item adjustments for these differences. I do the same in my CMAs, and I document the reasoning so my clients understand the logic, not just the number. For investors specifically, the adjustment for income potential matters too. If you're buying a duplex for its rent roll, the value has to be stress-tested against both the cost approach and the income approach, not just the sales comparison. That's a more involved conversation, and it's one I walk through with every investor client before we write an offer.
Step 5: Cross-reference against metro indices for long-term ROI. For buy-and-hold investors, I benchmark Pawtucket property values against the FHFA index to model appreciation scenarios over a five-to-ten year hold. The Providence-Warwick metro index at 452.64 in Q2 2026 (up from 444.32 in Q1) reflects the federal repeat-sales methodology, which is less noisy than portal data and better suited for long-horizon underwriting. Being licensed in Rhode Island, Massachusetts, and Connecticut also lets me benchmark Pawtucket against nearby cross-border sub-markets using the same federal index, which matters when investors are comparing opportunities across the metro's state line. Your specific ROI projection still depends on your acquisition price, financing structure, rent assumptions, and hold period. That's where a personalized analysis matters.
Inventory Shifts and What They Mean for Negotiating Power
The inventory picture has been shifting in 2026, and investors need to factor that into their offer strategy. Realtor.com's active-listing count for the Providence-Warwick metro, published through FRED, reached 2,464 in July 2026, up from 2,215 in July 2025, an increase of roughly 11% year-over-year. At the city level, Houzeo's Pawtucket page still characterized the market as favoring sellers with under two months of supply as of its spring 2026 update, so the extra inventory is more visible at the metro level than on any single Pawtucket street.
What does that mean practically? More inventory gives investors more options and slightly more room to negotiate, particularly on properties that have sat or had price reductions. But a well-priced, well-conditioned property is still moving fast and drawing multiple offers. Your CMA needs to tell you which category a given property falls into before you write the offer.
Here's what I'm seeing on the ground, and it tracks with the data: the Pawtucket investor market is split by condition. A rehabbed two-family or three-decker with clean mechanicals and market-rate units still goes fast, often with more than one offer on the table. Anything with real deferred maintenance is sitting longer, and that's where the negotiating room actually lives. I'm also seeing my investor clients get pickier as more listings come on. When there were three multifamilies to choose from, people stretched. With more options, they're passing on the marginal deals and waiting for the one where the numbers actually work. I think that's the right instinct, and a precise CMA is what lets you tell the difference.
What This Means for Your Next Pawtucket Offer
Put the pieces together and the strategy is clear. Before you write on a Pawtucket investment property, you should know three things: what the last 90 days of true comps say the property is worth after condition and configuration adjustments, whether the listing falls into the fast-moving rehabbed category or the slower deferred-maintenance category, and what the FHFA trend implies for your exit if you hold five to ten years.
An appraiser-style CMA answers all three. It's also your strongest negotiating tool. In a market where the typical home still closes at or above list, a documented value analysis carries more weight with a listing agent than a low-ball number with no reasoning behind it. If you're weighing Pawtucket against other towns in the metro, my Cumberland investment analysis walks through how the entry point changes the strategy, and my Pawtucket buyer's guide covers the basics for anyone new to the city.
Frequently Asked Questions
What's the difference between an agent CMA and an appraiser's approach for a Pawtucket investment property?
A standard agent CMA selects a handful of recent sales and brackets the subject property between them. An appraiser-style CMA goes further: it makes explicit, documented adjustments for differences in square footage, condition, configuration, and time of sale, and it cross-references the sales comparison approach against a price-per-square-foot or income analysis. For investment properties in Pawtucket, that extra rigor matters because the gap between a rehabbed and unrehabbed unit can be significant, and a loose comp selection can lead to a bad offer price in either direction.
What data points matter most when analyzing a Pawtucket rental property?
For investment property analysis, I weight price per square foot, price per unit (for multifamily), days on market, and the sale-to-list ratio most heavily. Pawtucket's median price per square foot was roughly $252 for the three months ending June 2026, per Redfin, which gives you a baseline for comparing rehabbed versus unrehabbed inventory. Cap rate matters too, but it's only as reliable as your rent and expense assumptions, which need to be grounded in current market rents, not pro forma projections.
How fast are Pawtucket investment properties selling in 2026, and does that hurt my negotiating position?
Pawtucket homes sold in roughly 22 days on average for the three-month period ending June 2026, according to Redfin. That pace means well-priced properties are not sitting long enough for investors to negotiate from a position of patience. Your best leverage comes from knowing the data better than the seller, not from waiting them out. A precise CMA that documents value clearly is a stronger negotiating tool than a low-ball offer in a market where the typical home closes at or above list price.
How should I weigh 2025 sold comps against 2026 list prices when pricing a Pawtucket duplex?
Sold comps from 2025 are still usable, but they need a time adjustment to account for the modest appreciation the market has experienced since then. The FHFA index for the Providence-Warwick metro shows continued quarterly appreciation into Q2 2026, so a comp from mid-2025 will generally understate current value without that adjustment. Active list prices are useful as a ceiling check, not as a value anchor. I always weight recent sold comps more heavily than current listings, and I document the time adjustment explicitly in my analysis.
Is Pawtucket still a viable cash-flow market in 2026 compared to the rest of the Providence metro?
Pawtucket's price growth has been moderate, with 2.5% year-over-year appreciation in the June 2026 period, and the city-level supply picture still leans toward sellers according to Houzeo's Pawtucket market page, so the entry point matters. That moderation can support cash flow if acquisition prices stay in line with rent levels, but the math is property-specific and, in my experience, it depends heavily on condition: the rehabbed inventory is priced for the appreciation buyer, while the deferred-maintenance inventory is where a cash-flow buyer can still find room. The only way to know if a specific property cash-flows is to run the actual numbers, and that's a conversation worth having before you make an offer.
An appraiser-style CMA is not a luxury in Pawtucket's 2026 market. It's the foundation of every good investment decision. If you want a data-driven analysis on a property you're considering, I'm ready to run it with you, in English or Spanish. Call or text me anytime at 401-426-4857, or explore the market and reach out at alexparmenidez.realtor.
Check out this article next

Términos Comunes de Bienes Raíces Explicados: Una Guía Sencilla para Compradores y Vendedores
as transacciones inmobiliarias involucran muchos términos desconocidos que pueden resultar abrumadores, especialmente para compradores y vendedores
Read ArticleLooking at a 2–4 family?
Run the real numbers before you offer.
Actual versus market rents, the FHA self-sufficiency test, taxes, insurance and financing. Alex has closed more than 275 transactions, many of them multifamily in Providence, Pawtucket and Central Falls, and will tell you plainly whether a property works.
Schedule a multifamily callEnglish or Spanish · Call or text 401-426-4857 · Contact form
196 Waterman St, Providence, RI 02906 · C: (401) 426-4857 · O: (401) 351-2017 · [email protected] · alexparmenidez.realtor